


In this article, we will take a deep dive into the background of the company’s that will be disclosing their earnings report very soon, with the help of stock price action including its historical performance and the factors that have influenced it.
We will also take a look at the predicted volatility of the stock and provide charts and other visual aids to help you better understand the company’s current position in the market.
Goldman Sachs
Goldman Sachs, one of the world’s leading investment banks, has had a strong performance in the stock market over the past year. According to recent data, the company’s Beta (5Y Monthly) is 1.42, indicating that the stock is more volatile than the overall market.
Over the past 52 weeks, Goldman Sachs has seen a change of 5.53%, which is significantly better than the S&P500’s change of -12.63%. This suggests that the company has been able to weather the economic downturn caused by the COVID-19 pandemic better than the overall market.

The company’s 52-week high is 389.58, and its 52-week low is 277.84, indicating that the stock has had a relatively stable performance over the past year. Additionally, the 50-day moving average is 363.51, while the 200-day moving average is 329.21. This suggests that the stock has been trending upward over the past few months, and has the potential for continued growth in the future.
Overall, Goldman Sachs has had a strong performance in the stock market recently, and the company’s stability and upward trend suggest that it may be a good investment for those looking for a solid, long-term return.
Morgan Stanley
The stock price of Morgan Stanley Corporation has had a mixed performance over the past year, according to recent data.
Morgan Stanley Corporation has seen a change of -2.50%, which is slightly worse than the S&P500’s change of -12.63%. This suggests that the company has not been able to avoid the economic downturn caused by the COVID-19 pandemic as well as the overall market. However, it is important to note that the stock is less volatile than the market as a whole.
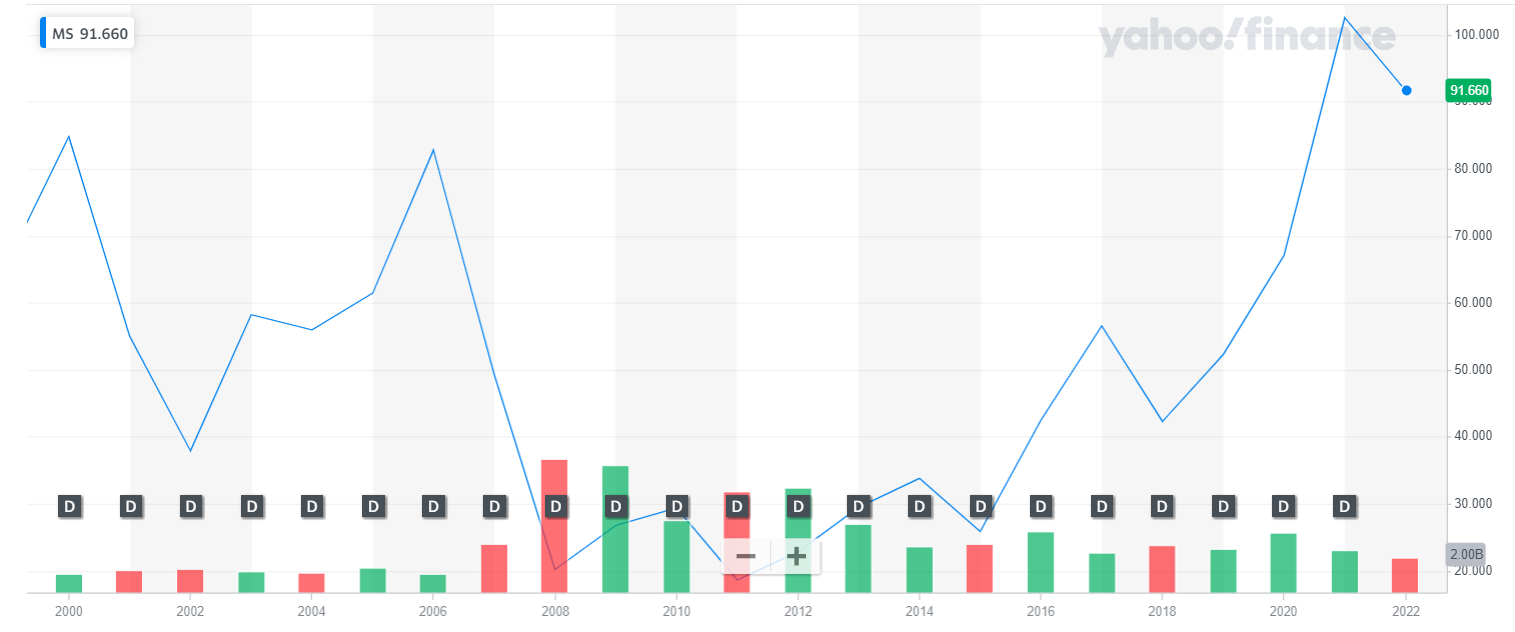
The company’s 52-week high is 109.73, and its 52-week low is 72.05, indicating that the stock has had a relatively volatile performance over the past year. Additionally, the 50-day moving average is 88.19, while the 200-day moving average is 84.07. This suggests that the stock has been trending upward over the past few months, but it is important to keep an eye on its volatility.
It is also worth noting that the stock price history is only one aspect to consider when evaluating a stock. Other factors such as the company’s financials, management and industry outlook also play an important role in determining the stock’s potential.
Overall, Morgan Stanley Corporation stock has had a mixed performance in the past year, and it’s important for investors to keep in mind the company’s volatility and to do their own research before making any investment decisions.
Netflix
Netflix, the popular streaming service, has had a challenging year in the stock market, according to recent data. The company’s Beta (5Y Monthly) is 1.17, indicating that the stock is less volatile than the overall market.
Over the past 52 weeks, Netflix has seen a change of -34.84%, which is significantly worse than the S&P500’s change of -12.63%. This suggests that the company has been impacted more by the economic downturn caused by the COVID-19 pandemic than the overall market.

The company’s 52-week high is 526.64, and its 52-week low is 162.71, indicating that the stock has had a significant decline in performance over the past year. Additionally, the 50-day moving average is 297.31, while the 200-day moving average is 246.26. This suggests that the stock has been trending downward over the past few months.
It’s worth noting that the streaming giant’s stock price has been affected due to the pandemic, as the lockdowns and social distancing measures led to an increase in the number of subscribers, but that also led to an increase in the company’s expenses. The company had also guided to a slowdown in subscriber growth for the next quarter, which had a negative impact on the stock price.
Investors should keep in mind that stock prices can fluctuate for various reasons and it’s important to do their own research and to consider the company’s overall financial and industry outlook before making any investment decisions.
Microsoft
Microsoft, the technology giant, has seen a decline in its stock price over the past year, according to recent data. The company’s Beta (5Y Monthly) is 0.93, indicating that the stock is less volatile than the overall market.
Over the past 52 weeks, Microsoft has seen a change of -20.95%, which is worse than the S&P500’s change of -12.63%. This suggests that the company has been affected by the economic downturn caused by the COVID-19 pandemic, but not as much as the overall market.

The company’s 52-week high is 315.95, and its 52-week low is 213.43, indicating that the stock has had a significant decline in performance over the past year. Additionally, the 50-day moving average is 239.97, while the 200-day moving average is 257.76. This suggests that the stock has been trending downward over the past few months.
It’s worth noting that Microsoft, despite the pandemic, has seen an increase in its revenues, driven by its Cloud division and the increased demand for work-from-home solutions. However, the company’s share price may have been affected by the overall market conditions and investor sentiment.
Investors should keep in mind that stock prices can fluctuate for various reasons and it’s important to do their own research and to consider the company’s overall financial and industry outlook before making any investment decisions. Microsoft, with its strong fundamentals, has the potential for growth in the long run.
Tesla
Tesla, the electric vehicle manufacturer, has had a challenging year in the stock market, according to recent data. The company’s Beta (5Y Monthly) is 2.03, indicating that the stock is more volatile than the overall market.
Over the past 52 weeks, Tesla has seen a change of -64.37%, which is significantly worse than the S&P500’s change of -12.63%. This suggests that the company has been impacted more by the economic downturn caused by the COVID-19 pandemic than the overall market.

The company’s 52-week high is 384.29, and its 52-week low is 101.81, indicating that the stock has had a significant decline in performance over the past year. Additionally, the 50-day moving average is 161.07, while the 200-day moving average is 242.51. This suggests that the stock has been trending downward over the past few months.
It’s worth noting that the company’s stock price has been affected by the overall market conditions and investor sentiment, as well as the decrease in demand for vehicles caused by the pandemic. Additionally, the company’s ambitious plans for expansion, including the development of new models and a focus on energy storage and solar power systems, has led to increased expenses, which may have also affected the stock price.
Investors should keep in mind that stock prices can fluctuate for various reasons and it’s important to do their own research and to consider the company’s overall financial and industry outlook before making any investment decisions. While Tesla’s stock has seen a significant decline, the company’s ambitious plans and focus on sustainable energy may make it an interesting long-term investment.
SoFi Technologies
SoFi Technologies, the financial technology company, has had a challenging year in the stock market, according to recent data. The company’s Beta (5Y Monthly) is 1.38, indicating that the stock is more volatile than the overall market.
Over the past 52 weeks, SoFi Technologies has seen a change of -54.89%, which is significantly worse than the S&P500’s change of -12.63%. This suggests that the company has been impacted more by the economic downturn caused by the COVID-19 pandemic than the overall market.

The company’s 52-week high is 16.47, and its 52-week low is 4.24, indicating that the stock has had a significant decline in performance over the past year. Additionally, the 50-day moving average is 4.84, while the 200-day moving average is 6.00. This suggests that the stock has been trending downward over the past few months.
It’s worth noting that SoFi Technologies, as a fintech company, may have been affected by the overall market conditions and investor sentiment. The company’s business model relies on the health of the economy and consumers’ ability to borrow and invest, which may have been impacted by the pandemic.
Investors should keep in mind that stock prices can fluctuate for various reasons and it’s important to do their own research and to consider the company’s overall financial and industry outlook before making any investment decisions. While the stock has seen a significant decline, the company’s innovative business model and focus on technology may make it an interesting long-term investment.
AMD
Advanced Micro Devices (AMD), a semiconductor manufacturer, has had a challenging year in the stock market, according to recent data. The company’s Beta (5Y Monthly) is 1.98, indicating that the stock is more volatile than the overall market.
Over the past 52 weeks, AMD has seen a change of -46.18%, which is worse than the S&P500’s change of -12.63%. This suggests that the company has been impacted more by the economic downturn caused by the COVID-19 pandemic than the overall market.

The company’s 52-week high is 136.39, and its 52-week low is 54.57, indicating that the stock has had a significant decline in performance over the past year. Additionally, the 50-day moving average is 68.66, while the 200-day moving average is 81.20. This suggests that the stock has been trending downward over the past few months.
It’s worth noting that AMD’s stock price may have been affected by the overall market conditions and investor sentiment, as well as the decrease in demand for personal computers and servers caused by the pandemic. Additionally, the company’s strong competition in the semiconductor industry may have also affected the stock price.
Investors should keep in mind that stock prices can fluctuate for various reasons and it’s important to do their own research and to consider the company’s overall financial and industry outlook before making any investment decisions. While AMD’s stock has seen a significant decline, the company’s strong financials and competitive positioning in the semiconductor industry may make it an interesting long-term investment.
Snap
Snap Inc, the social media company, has had a challenging year in the stock market, according to recent data. The company’s Beta (5Y Monthly) is 1.02, indicating that the stock is less volatile than the overall market.
Over the past 52 weeks, Snap has seen a change of -72.55%, which is significantly worse than the S&P500’s change of -12.63%. This suggests that the company has been impacted more by the economic downturn caused by the COVID-19 pandemic than the overall market.

The company’s 52-week high is 41.97, and its 52-week low is 7.33, indicating that the stock has had a significant decline in performance over the past year. Additionally, the 50-day moving average is 9.64, while the 200-day moving average is 14.69. This suggests that the stock has been trending downward over the past few months.
It’s worth noting that Snap’s stock price may have been affected by the overall market conditions and investor sentiment, as well as the decrease in advertising revenues caused by the pandemic. Additionally, the company’s competition with other social media platforms such as Facebook and Instagram may have also affected the stock price.
Investors should keep in mind that stock prices can fluctuate for various reasons and it’s important to do their own research and to consider the company’s overall financial and industry outlook before making any investment decisions. While Snap’s stock has seen a significant decline, the company’s strong user base and innovative features may make it an interesting long-term investment.
PayPal
PayPal, the digital payments company, has had a challenging year in the stock market, according to recent data. The company’s Beta (5Y Monthly) is 1.28, indicating that the stock is more volatile than the overall market.
Over the past 52 weeks, PayPal has seen a change of -54.44%, which is significantly worse than the S&P500’s change of -12.63%. This suggests that the company has been impacted more by the economic downturn caused by the COVID-19 pandemic than the overall market.

The company’s 52-week high is 179.88, and its 52-week low is 66.39, indicating that the stock has had a significant decline in performance over the past year. Additionally, the 50-day moving average is 76.82, while the 200-day moving average is 85.14. This suggests that the stock has been trending downward over the past few months.
PayPal’s stock price may have been affected by the overall market conditions and investor sentiment, as well as the decrease in e-commerce transactions caused by the pandemic. Additionally, the company’s increasing competition in the digital payments space may have also affected the stock price.
Investors should keep in mind that stock prices can fluctuate for various reasons and it’s important to do their own research and to consider the company’s overall financial and industry outlook before making any investment decisions. While PayPal’s stock has seen a significant decline, the company’s strong financials, user base and innovative features may make it an interesting long-term investment.


