

Lucid Group completed its first quarter as a public company with a booming stock price and customer deliveries underway, as it seeks to grab the top spot in the burgeoning luxury EV market.
Lucid Group, Inc. (Nasdaq: LCID) (“Lucid” or the “Company”), which is setting new standards with its advanced technologies and luxury electric vehicles (“EVs”), had announced financial results for the third quarter ending September 30, 2021.
Peter Rawlinson, CEO & CTO of Lucid, said, “We are tremendously excited by our accomplishments in our first quarter as a publicly-traded company. We successfully began production of vehicles for customer deliveries, continued investing in capacity expansion of our manufacturing facility in Arizona, and opened new retail and service locations in advance of the Lucid Air launch. We were also pleased to receive independent validation by the EPA of our industry-leading range of over 500 miles for the Lucid Air. Our progress this quarter demonstrates our focus on execution, our cutting-edge technology, and our vision to help with solutions to address the climate challenges we all face. We look forward to ramping up production of our Grand Touring, Touring, and Pure models and expanding our footprint internationally.”

Overall, customer reservations increased to 13,000 in the third quarter, which reflects revenues of around $1.3 billion, the company said. Since the quarter’s closing, reservations jumped again to more than 17,000; that’s up from 11,000 reservations in July.
The bulk of reservations are being made by people in the U.S., Lucid Group CEO Peter Rawlinson told investors Monday, with Saudi Arabia taking the second spot by order of reservations. The company has received major financial investment from Saudi Arabia’s sovereign wealth fund, and the fund continues to be the automaker’s largest shareholder.
Third Quarter Financial Highlights
The company is closing the quarter with around $4.8 billion in cash, which includes $4.4 billion from the SPAC merger and PIPE, as well as cash on the balance sheet at the time of the deal’s closing.
Continued to invest in the business, readying production and deliveries, globalization of our retail network, and adding headcount across R&D and SG&A to continue growing our core operations.
Initiated investment in property, plant, and equipment associated with Phase 2 expansion of manufacturing, continued investment in vehicle program development, and ongoing expansion of retail, delivery, and service capacities.
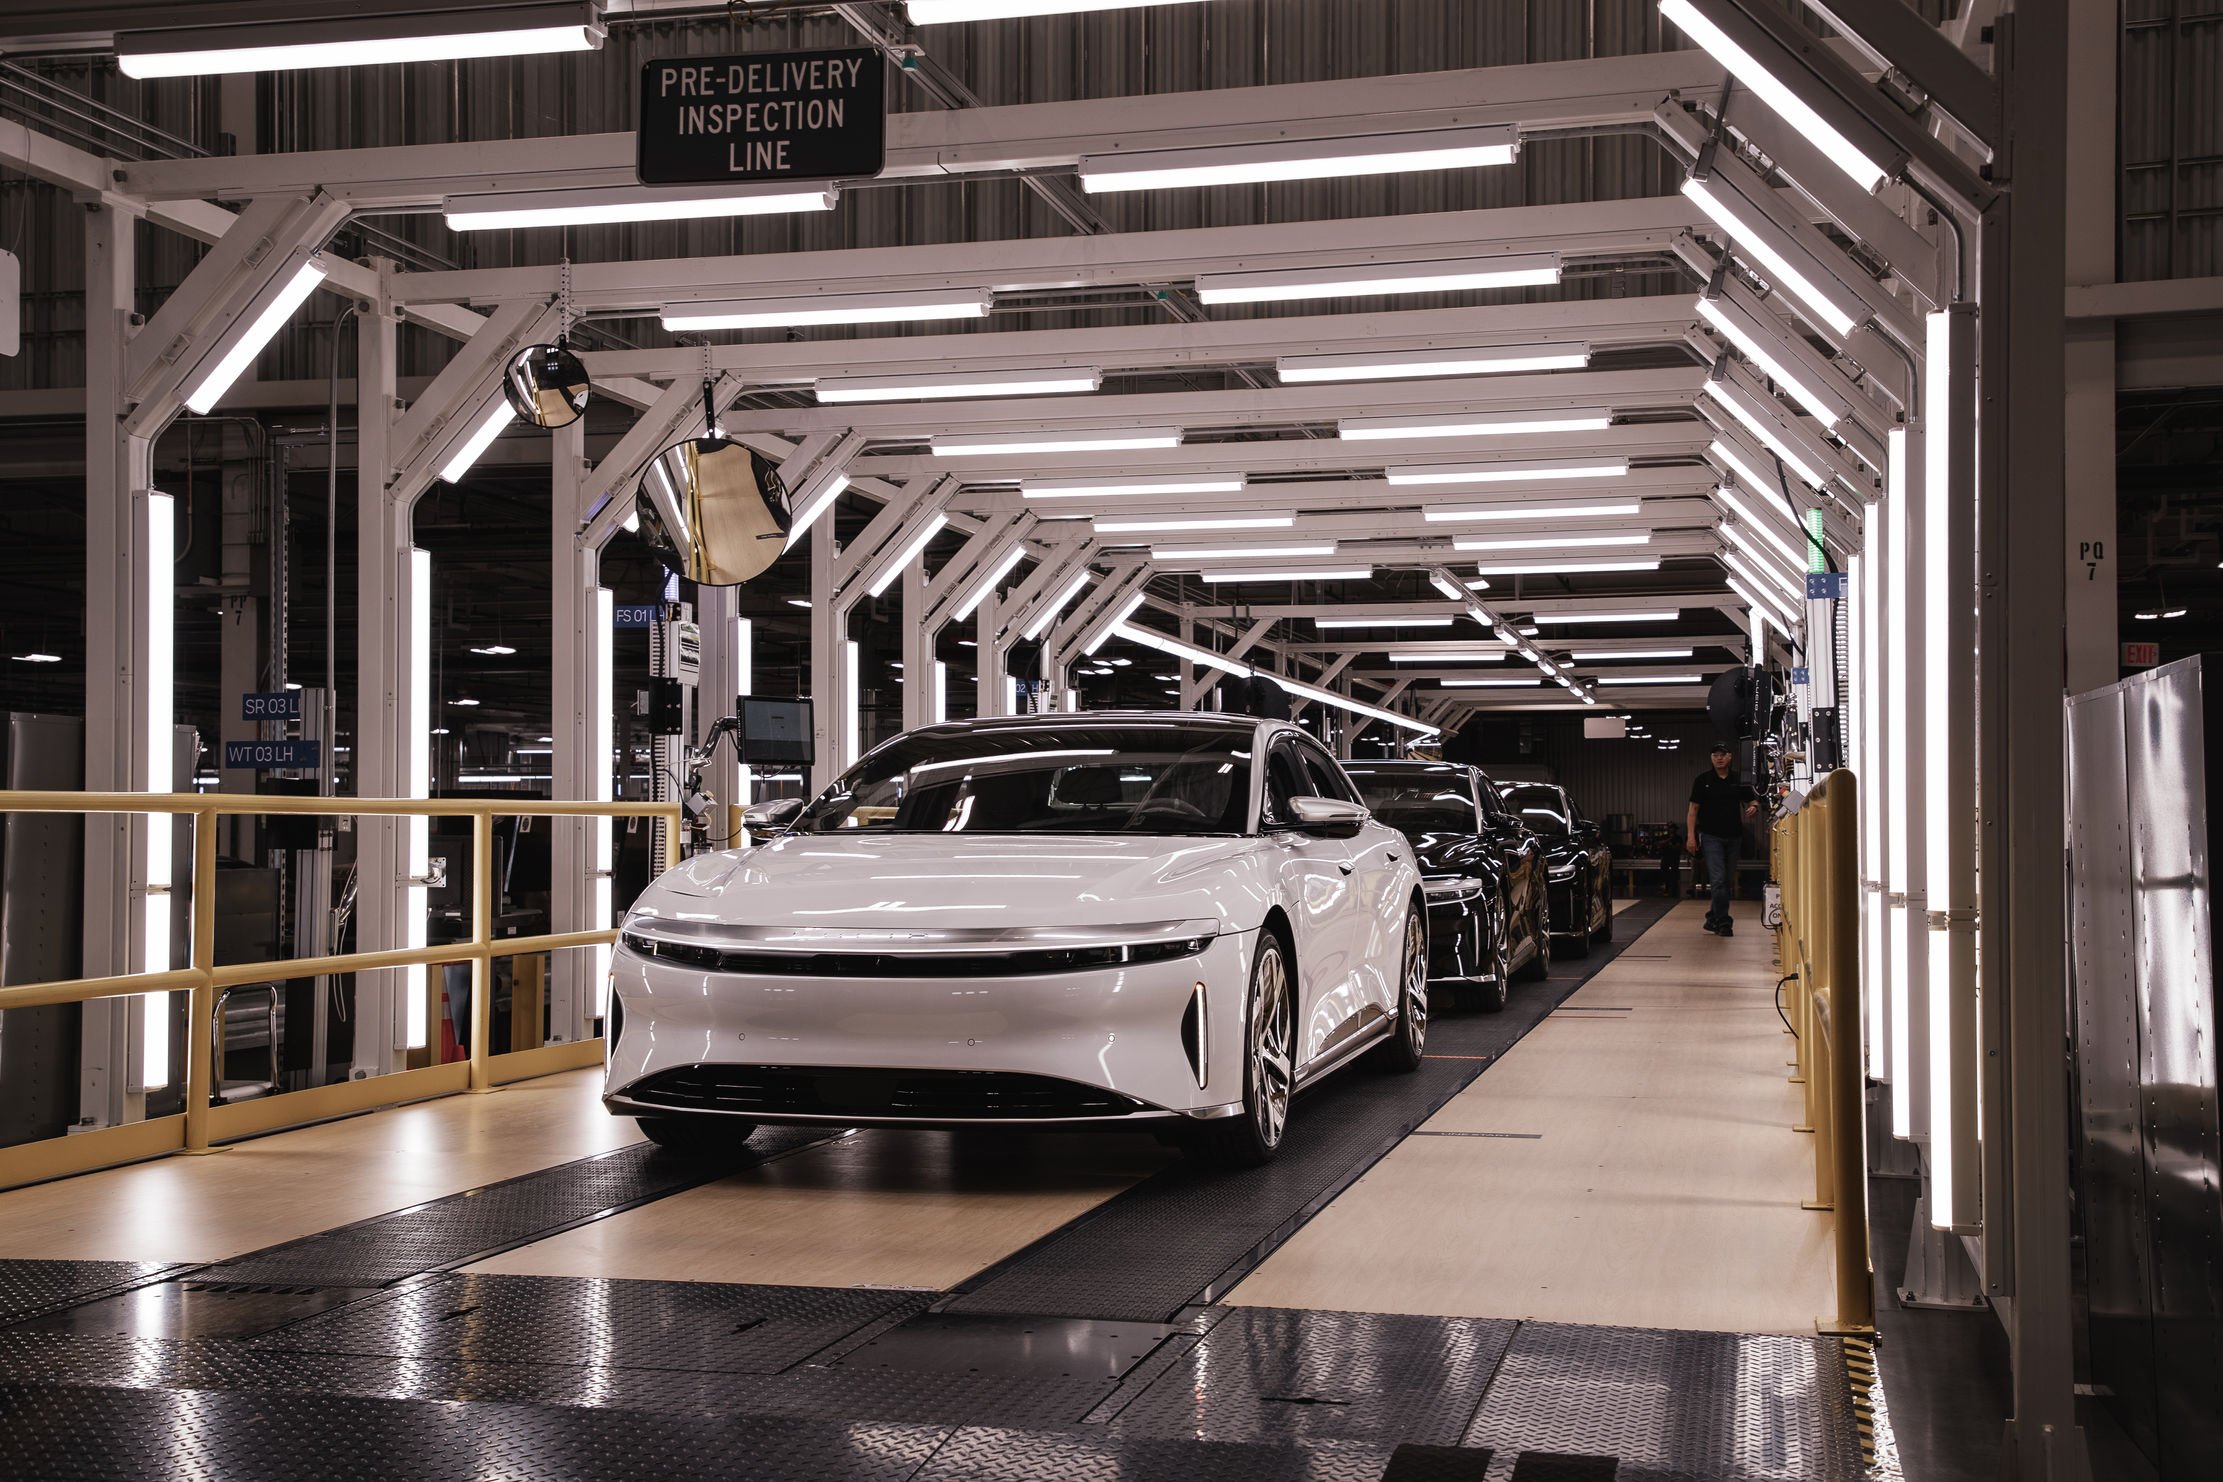
The vehicles are manufactured in Lucid’s manufacturing facility in Casa Grande, Arizona, which it plans to expand by around 2.85 million square feet. The aim is to eventually manufacture up to 90,000 vehicles per year at the facility by the end of 2023, including the mysterious “Project Gravity” SUV, and up to 365,000 units overall, Rawlinson said.
| LUCID GROUP, INC. | |||||||||||||||
| CONDENSED CONSOLIDATED STATEMENTS OF OPERATIONS AND COMPREHENSIVE LOSS1 | |||||||||||||||
| Unaudited | |||||||||||||||
| (in thousands, except share and per share data) | |||||||||||||||
| Three Months Ended
September 30, |
Nine Months Ended
September 30, |
||||||||||||||
| 2021 | 2020 | 2021 | 2020 | ||||||||||||
| Revenue | $ | 232 | $ | 334 | $ | 719 | $ | 342 | |||||||
| Cost of revenue | 3,320 | 609 | 3,424 | 550 | |||||||||||
| Gross profit | (3,088) | (275) | (2,705) | (208) | |||||||||||
| Operating expenses | |||||||||||||||
| Research and development | 242,408 | 133,890 | 586,579 | 341,589 | |||||||||||
| Selling, general and administrative | 251,554 | 27,935 | 455,478 | 57,719 | |||||||||||
| Total operating expenses | 493,962 | 161,825 | 1,042,057 | 399,308 | |||||||||||
| Loss from operations | (497,050) | (162,100) | (1,044,762) | (399,516) | |||||||||||
| Other income (expense), net | |||||||||||||||
| Change in fair value of forwarding contracts | — | — | (454,546) | (8,719) | |||||||||||
| Change in fair value of convertible preferred stock warrants liability | — | (57) | (6,976) | (171) | |||||||||||
| Change in fair value of common stock warrants liability | (24,787) | — | (24,787) | — | |||||||||||
| Transaction costs expensed | (2,717) | — | (2,717) | 0 | |||||||||||
| Interest expense | (76) | (10) | (111) | (20) | |||||||||||
| Other income (expense), net | 249 | 785 | (151) | 76 | |||||||||||
| Total other income (expense), net | (27,331) | 718 | (489,288) | (8,834) | |||||||||||
| Loss before provision for (benefit from) income taxes | (524,381) | (161,382) | (1,534,050) | (408,350) | |||||||||||
| Provision for (benefit from) income taxes | 22 | (145) | 31 | (245) | |||||||||||
| Net loss and comprehensive loss | (524,403) | (161,237) | (1,534,081) | (408,105) | |||||||||||
| Deemed dividend related to the issuance of Series E convertible preferred stock | — | — | (2,167,332) | — | |||||||||||
| Net loss attributable to common stockholders | $ | (524,403) | $ | (161,237) | $ | (3,701,413) | $ | (408,105) | |||||||
| Weighted average shares outstanding used in computing net loss per share attributable to common stockholders, basic and diluted | 1,217,032,285 | 24,279,817 | 432,654,607 | 20,889,062 | |||||||||||
| Net loss per share attributable to common stockholders, basic and diluted | $ | (0.43) | $ | (6.64) | $ | (8.56) | $ | (19.54) | |||||||


