

In an energy world increasingly driven by data, what if the next major breakthrough wasn’t more data but data that felt?
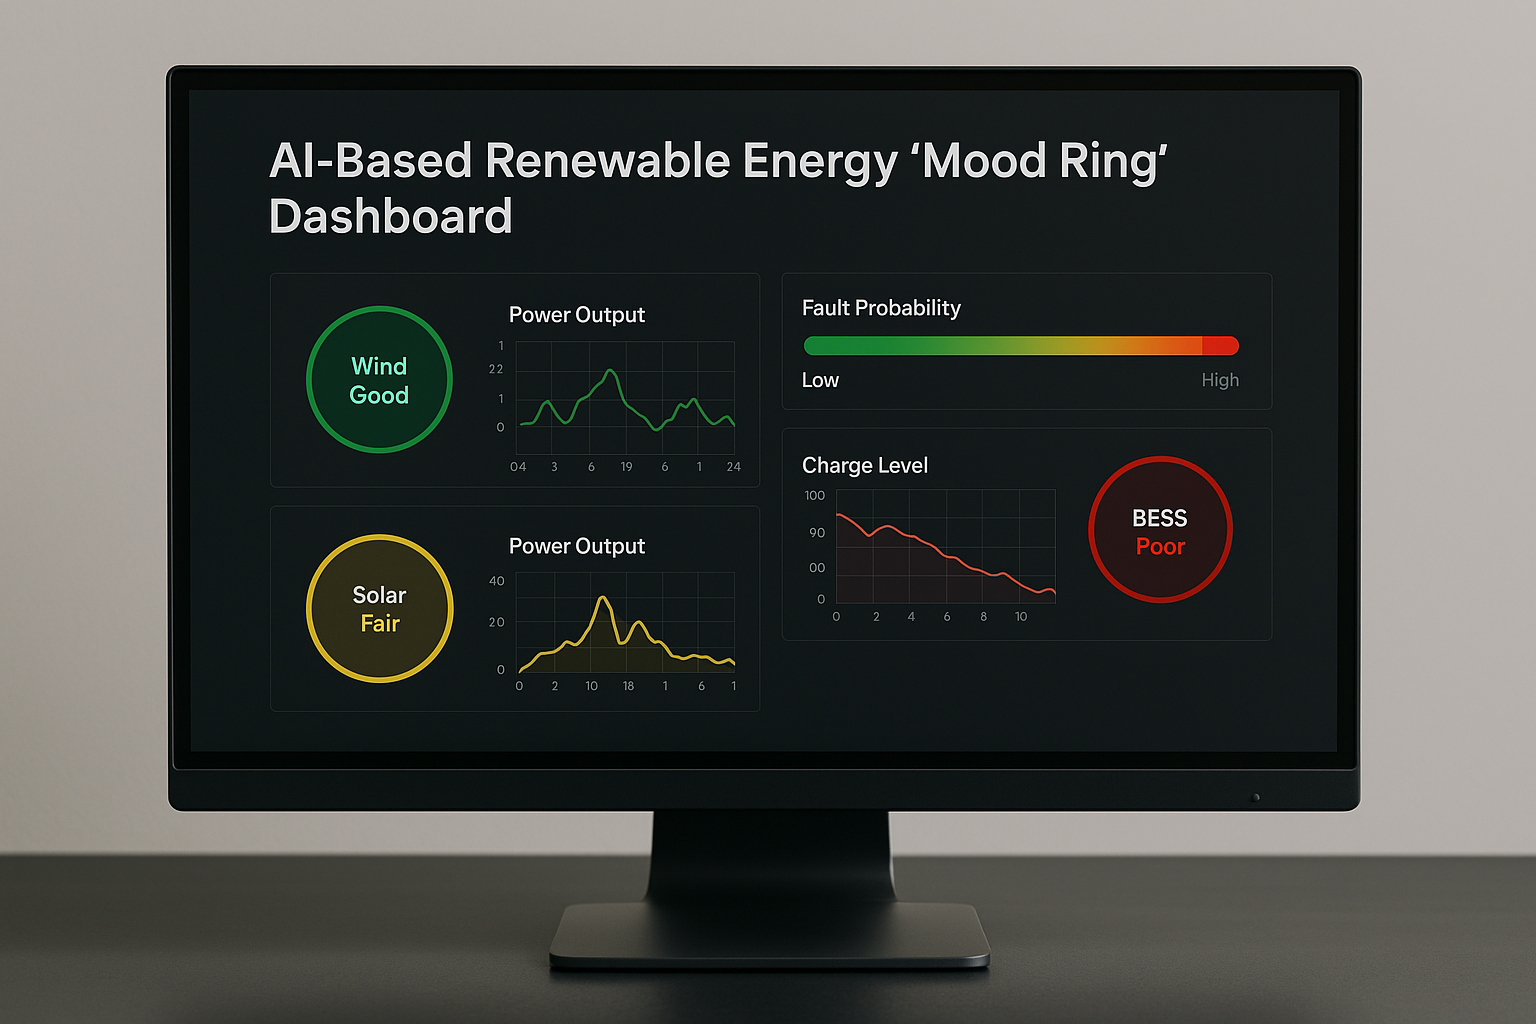
Imagine a control room where solar panels glow a serene green when generation is optimal, wind turbines pulse amber under mechanical strain, and battery systems flash crimson moments before instability. This isn’t abstract design. It’s the foundation of the AI-Based Mood Ring Dashboard a new paradigm in clean energy monitoring that I’ve developed to humanize machine diagnostics and fast-track critical decisions.
The concept is simple yet profound: an AI system that translates raw asset performance into mood-based colour feedback, enabling operators to act instinctively in complex, high-stakes environments. Inspired by the iconic mood ring of the 1970s, which reflected physiological changes through colour, this system reflects operational stress, fault probability, and performance sentiment in real time through light, not lines.
Underneath the visuals is a machine learning engine trained on years of operational data — turbine vibrations, inverter waveforms, panel temperature curves, battery charge profiles, and local weather anomalies. This AI computes a Real-Time Mood Index (RTMI), assigning each asset a dynamic “mood” based on explainable fault likelihood and behavioural drift.
What sets this apart is not just the analysis, but the interface philosophy. Traditional dashboards bury insights under rows of metrics. This interface communicates urgency visually — green signals stability, amber suggests warning, and crimson demands intervention. Operators no longer read. They feel.
This approach is not speculative. Harvard Business Review (2020) emphasized the role of “empathic interfaces” in decision acceleration. MIT Technology Review (2022) noted how color-based interface design improves recognition speed by up to 30 percent in industrial applications. These insights shaped the dashboard’s neuro-design, which has been field-tested across wind and solar sites in the US and India.
Initial results are compelling. Sites using the Mood Ring Dashboard reported a 19% improvement in fault detection speed, 23% faster decisions by junior operators, and an 11% reduction in reactive maintenance costs — all within four months. In an industry where every minute of downtime can cost upwards of $2,000 per MW, this isn’t just a design win — it’s a financial breakthrough.
But perhaps the most transformative impact is psychological. Renewable energy systems are growing rapidly — more than 12% CAGR globally, according to the International Energy Agency. Yet the cognitive load on those managing them is escalating just as fast. By shifting asset monitoring from technical reading to intuitive sensing, the Mood Ring Dashboard helps restore confidence and clarity at scale.
This is more than visualization. It is a new language between humans and machines — one where color, emotion, and AI converge to create a smarter, more responsive energy grid. Because in the age of intelligent infrastructure, feeling the system might be the most intelligent thing we can do.


