


Bitcoin price action seems to be on the right track as it breaks the resistance of $33,700. After dipping below $30k for the first time since the crash, Bitcoin has shown some relief. It is now trading around $34,500 and is showing an upwards potential. Yesterday, the entire time, it was stuck near $33k and finally broke through with a 15-minute candle showing a 2000 dollar price increase. Unfortunately, it could not clear the resistance between $34,700-$35,100 and retreated a little.
Bitcoin’s price action
Since Bitcoin fell below 20 daily MA, its price has not seen any major ups. As of now, the price action of Bitcoin is similar to the Wyckoff distribution chart. But which one is it will be difficult to say. This is because there are two Wyckoff charts, 1st is the bearish distribution chart, and 2nd is the bullish accumulation chart. Depending on whether you are a bull or a bear you will be wishing either of this to be true.
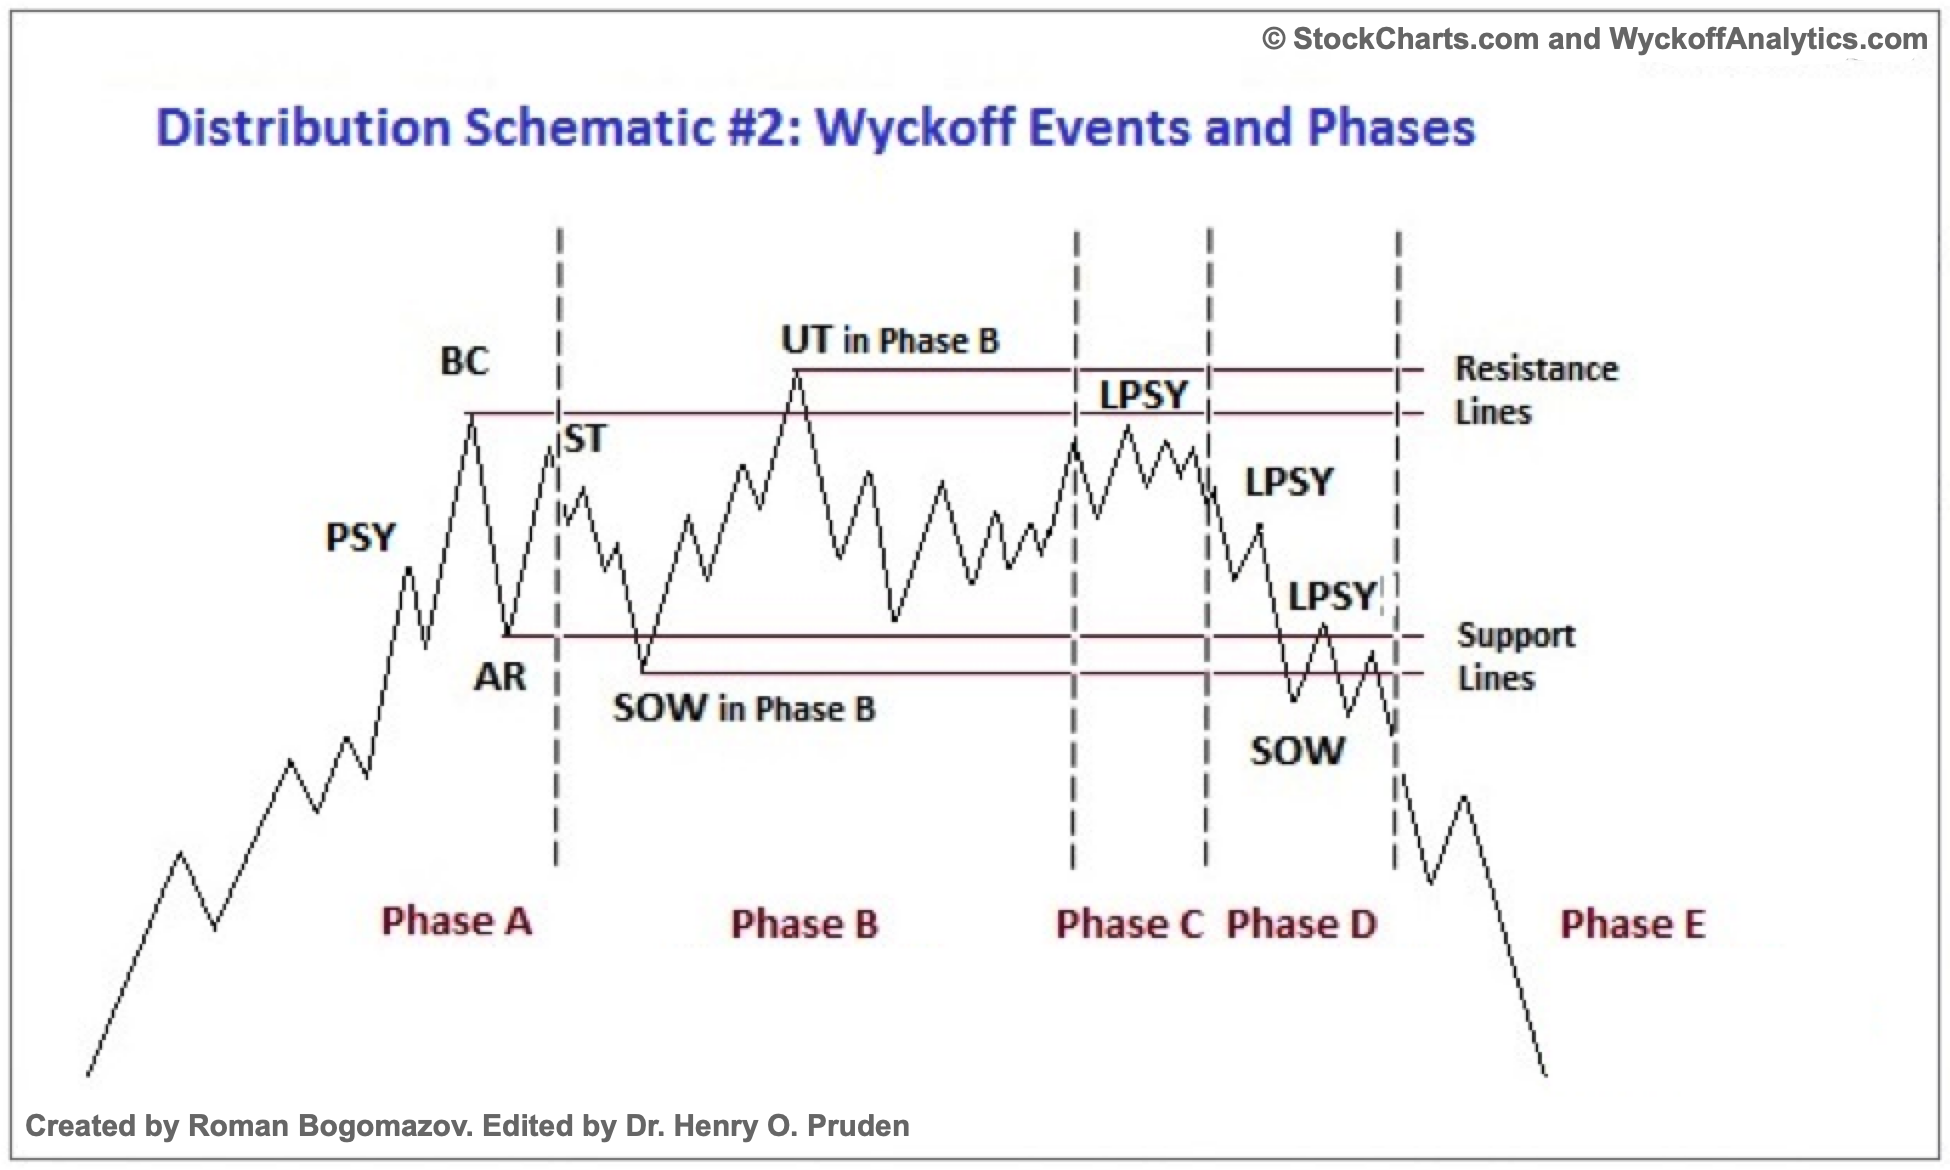
Let’s take a look at the bearish scenario 1st, because that seems more likely even though I am a bull myself. In that case, the top would be $64,000, and we are currently in Phase D, where there are some minor price jumps but nothing too much. If things follow this chart, then in Phase E, we might move to $20k or even lower (a little unlikely).
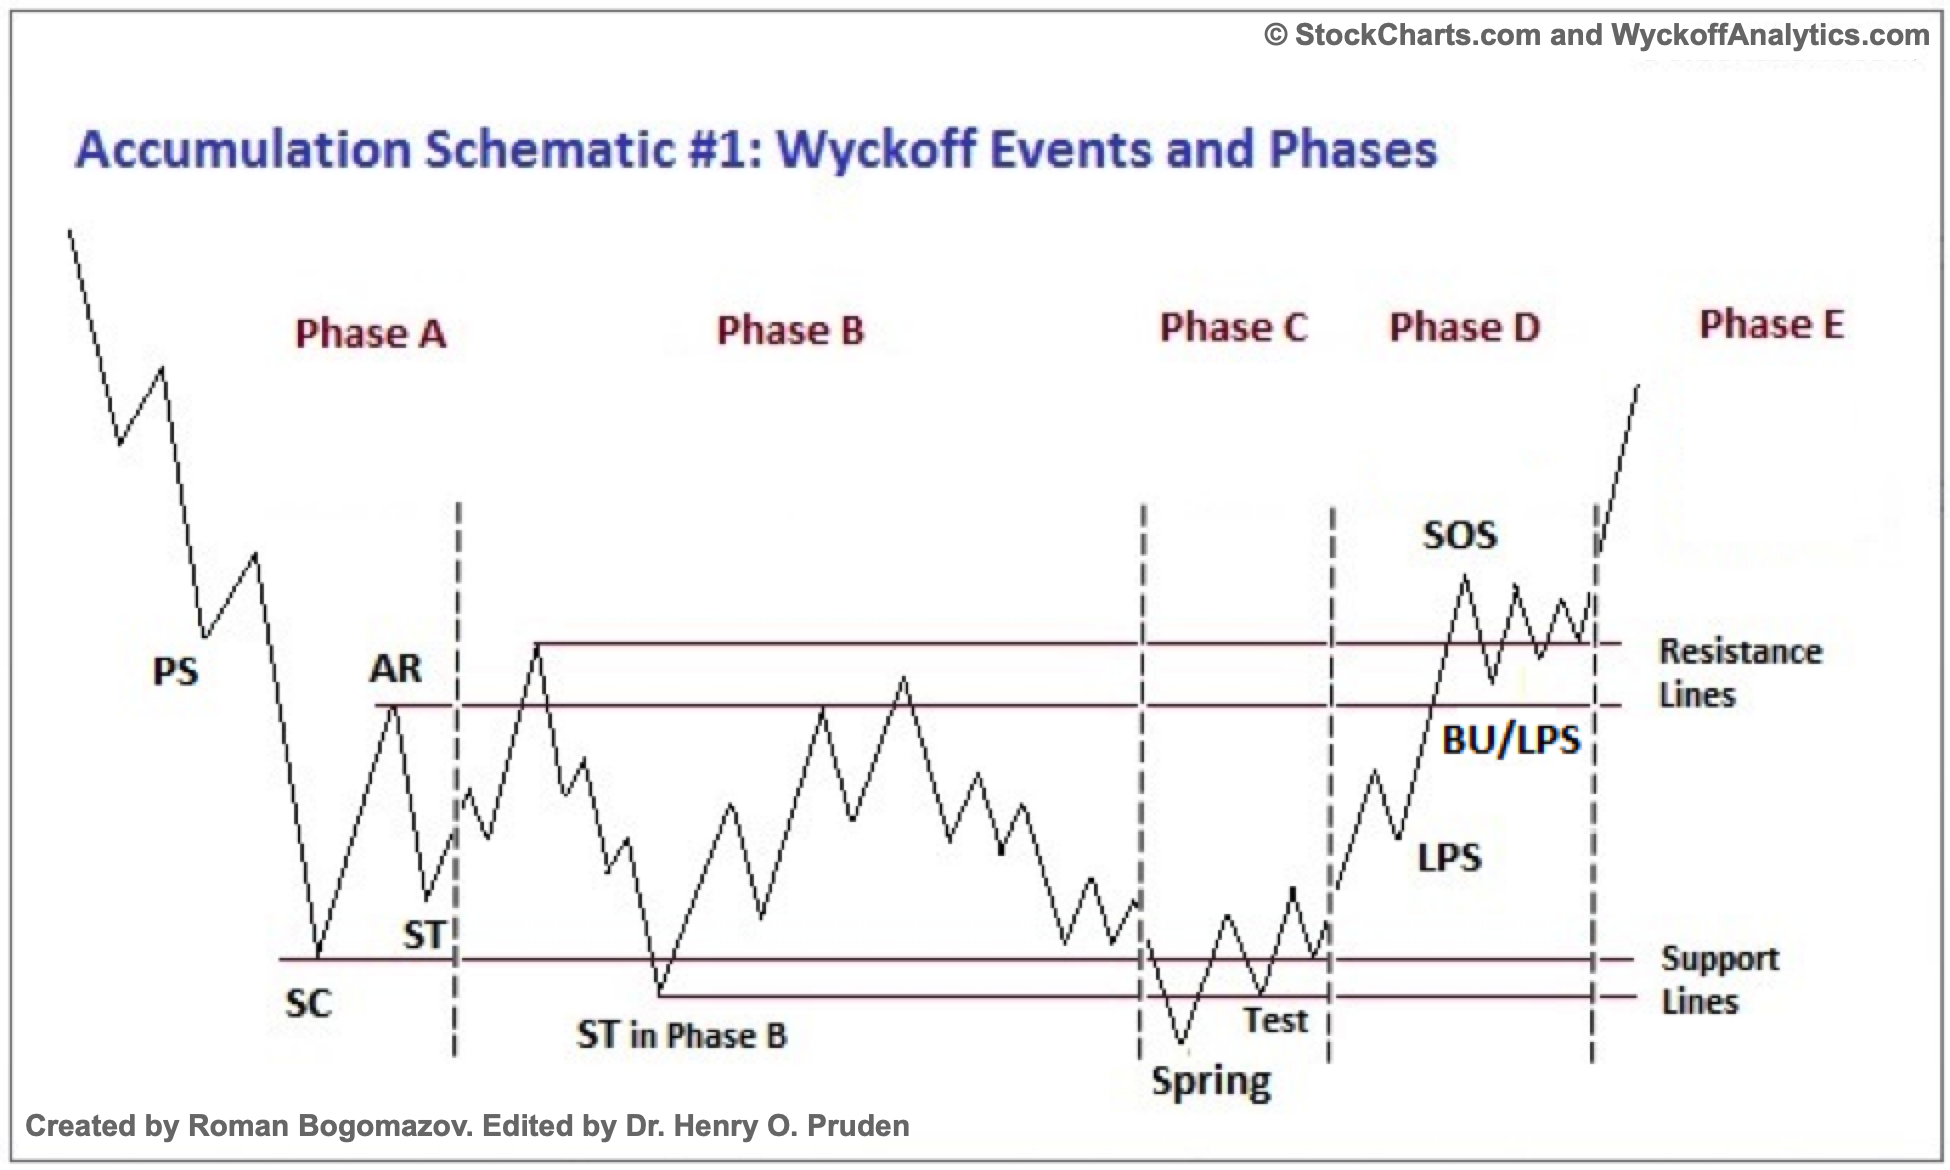
I am pretty sure that all Bitcoin bulls are hoping that the accumulation chart will be true. In that case, we are in Phase C, where BTC tested $28k-$30k support where it probably shook out many weak hands. And now it has moved back up again to near $35k. If things follow this pattern, we will soon see $40k and then move upwards. We might even make a new all-time high if BTC follows Wyckoff’s accumulation charts.
Don’t panic and HODL
I am not giving any financial advice, but it is obvious that Bitcoin HOLDERS have never experienced losses. We can’t predict the future, but we can expect an outcome based on previous data. Even if $64,000 were the top of this bull run, I would say fine, don’t sell at a loss and keep accumulating at lower prices. If price crashes, buy more and apply dollar-cost averaging. By the time the next bull run happens, an easy 5-10x returns are on the cards.
As Bitcoin breaks the resistance of $33,700 do you think we could see a move towards the forties? And are you bearish or bullish on Bitcoin right now? Let us know in the comments below. Also, if you found our content informative, do like and share it with your friends.
Also Read: Bitcoin might crash to $20k suggests Parabolic indicators


