


Bitcoin was designed with a variety of unique features by the mysterious Satoshi Nakamoto. It has a scarce supply of only 21 million BTC, and a distribution protocol that limits the amount of coins that enter the market.
The rest of the coins left uncirculated are locked away, only rewarded to miners whose sole purpose is to validate blocks and secure the network. The Bitcoin core code also includes a recurring halving event, which slashes the block reward in half roughly every four years.
It is this sudden shift in supply that offsets the balance of supply versus demand in a massive way, which creates an environment in financial markets where prices increase exponentially. This in a sense creates the boom and bust bubble cycles the first ever cryptocurrency is known for, which each new bubble sucking in more and more participants through network effect.
When the top is in, the bubble pops, Bitcoin drops by 80% or more, and the whole pattern repeats again four years later post-halving. Thus far, it has been like clockwork, repeating in the same pattern again and again. When comparing past market tops, a unique Bitcoin metric says the top of the current cycle is nowhere near.
Bitcoin Prediction Models Are Being Put To The Test
There are a variety of tools that investors, traders, analysts, and speculators alike use to predict future price targets or patterns in Bitcoin and other cryptocurrencies. This includes technical analysis, chart patterns, indicators and more. It also includes on-chain and other fundamental analysis. It also includes the use of economic or mathematical models that focus on a unique aspect of Bitcoin.
The stock-to-flow model, also called the S2F model, is one of the most highly publicized prediction models that analysts swear by. It follows a four year cycle that suggests Bitcoin will reach hundreds of thousands of dollars per coin before the top is in during this cycle. However, there is another less common tool that could even better show that the top isn’t yet in for those that doubt the stock-to-flow model.
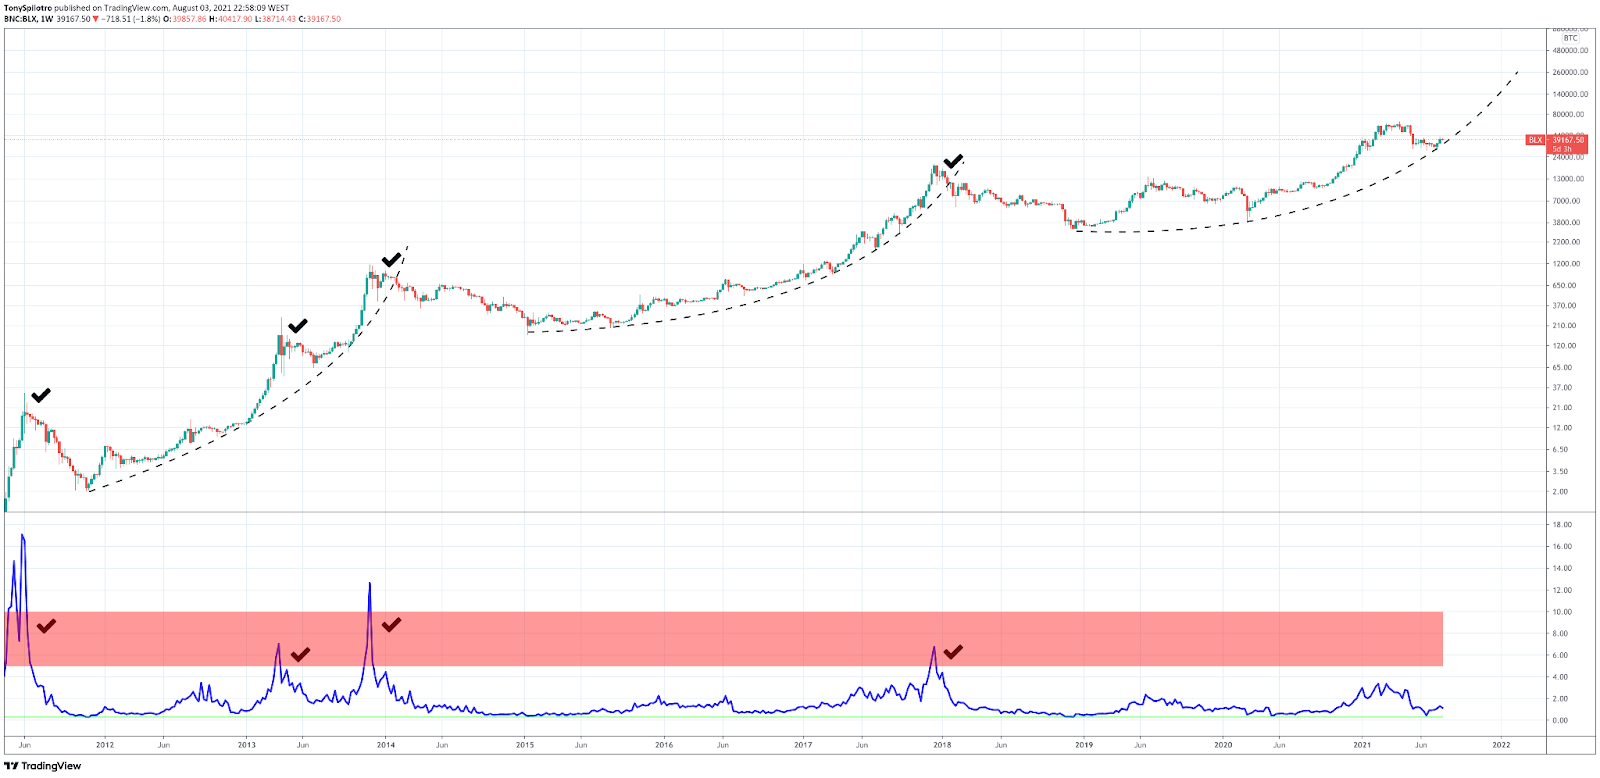
The other model is called the Puell Multiple, created by David Puell in March 2019. Although the tool is relatively new, it can look back at past Bitcoin cycles and it calls each one with supreme accuracy. Each major Bitcoin peak concluded with a push into the red zone in the chart below. The cycle only ended when the parabolic curve was completely broken, which has yet to happen during this cycle. With no red zone to speak of, and a parabolic curve intact, Bitcoin could soon blast off to new highs.
The Puell Multiple Explained And How To Use It
The Puell Multiple, according to the creator’s website, “looks at the supply side of Bitcoin’s economy” which is Bitcoin miners and their revenue. It is calculated by dividing the daily issuance value of BTC in USD by the 365-day moving average of daily issuance value.
“It explores market cycles from a mining revenue perspective. Bitcoin miners are sometimes referred to as compulsory sellers due to their need to cover fixed costs of mining hardware in a market where price is extremely volatile. The revenue they generate can therefore influence price over time,” the website reads.
What this basically translates to, is that the tool can explain when newly mined BTC that enter the ecosystem are priced so high compared to historical norms that miners will sell to secure profits strategically.
The red box itself “shows periods where the daily issuance value was extremely high, providing advantageous profit-taking for Bitcoin investors who sold here.” This boils down to, when Bitcoin reaches the red box on the Puell Multiple, it is often the very best time to sell your coins, because that’s when miners are selling in the most profit.
How To Profit From Any Additional Bitcoin Upside
Knowing that there is much more bull run and price potential ahead in Bitcoin and the rest of cryptocurrencies, investors and traders can alter their strategy in advance and prepare for the opportunity that lies in wait.
Investing and trading isn’t a one size fits all situation, so here are some potential ways to take advantage of the rest of any remaining Bitcoin bull run, if the crypto cycle does have another leg left.
Buy and HODL
Buying and holding is the most common way to get involved in Bitcoin and other cryptocurrencies. Investors that choose this path need to find a cryptocurrency exchange and then decide if they want to custody their own coins or not. Long-term HODLers are advised to secure their coins and private keys personally through a cold storage wallet. The challenge with holding, is that it is difficult to get out in time before a reversal hits, as the recent selloff has proven.
Bitcoin Trading
Margin trading cryptocurrency is a popular way to profit from the dramatic uptrends Bitcoin is known for. For example, had a trader went long on Bitcoin at $10,000 in late 2020, it could have later been closed successfully at $65,000 around local highs. In normal situations this would have resulted in a $55,000 profit, but with leverage, this could have been $5.5 million. Platforms such as PrimeXBT offer such professional trading solutions.
Stock Market Crypto Exposure
Investing in crypto related stocks such as MicroStrategy or Square is another popular way that some investors are gaining exposure to Bitcoin in a way they perceive to be safer. They let others take on the BTC exposure, and then gain exposure to the brands and businesses bold enough to do so. This strategy has proven successful for those from Wall Street that aren’t fully ready yet to take the plunge into crypto.
More Ways Coming In The Future
In the future, more and more ways to get involved in Bitcoin will develop. For example, PayPal, Venmo, and all offer Bitcoin and crypto exposure, however, they don’t offer full ownership or custody over the coins. This means you can’t move them off the platform if you wanted to to a wallet you own or elsewhere.


